Today, we’re excited to announce that the new usage page in the Power Platform admin center (PPAC) is available in public preview! This release delivers a modern, centralized way to understand how Microsoft Power Apps, Power Automate, and Copilot Studio are being used across your organization, empowering administrators with the reliable insights they need to make data-driven decisions with confidence.
With this preview, Microsoft Power Platform admins gain a clearer view into what drives engagement, which resources create the most impact, and where to focus efforts to accelerate adoption and value across the platform. To explore the experience, visit the documentation or simply head to the Power Platform admin center, select ‘Manage’ in the left navigation, and click on ‘Usage’ to bring up the new experience.
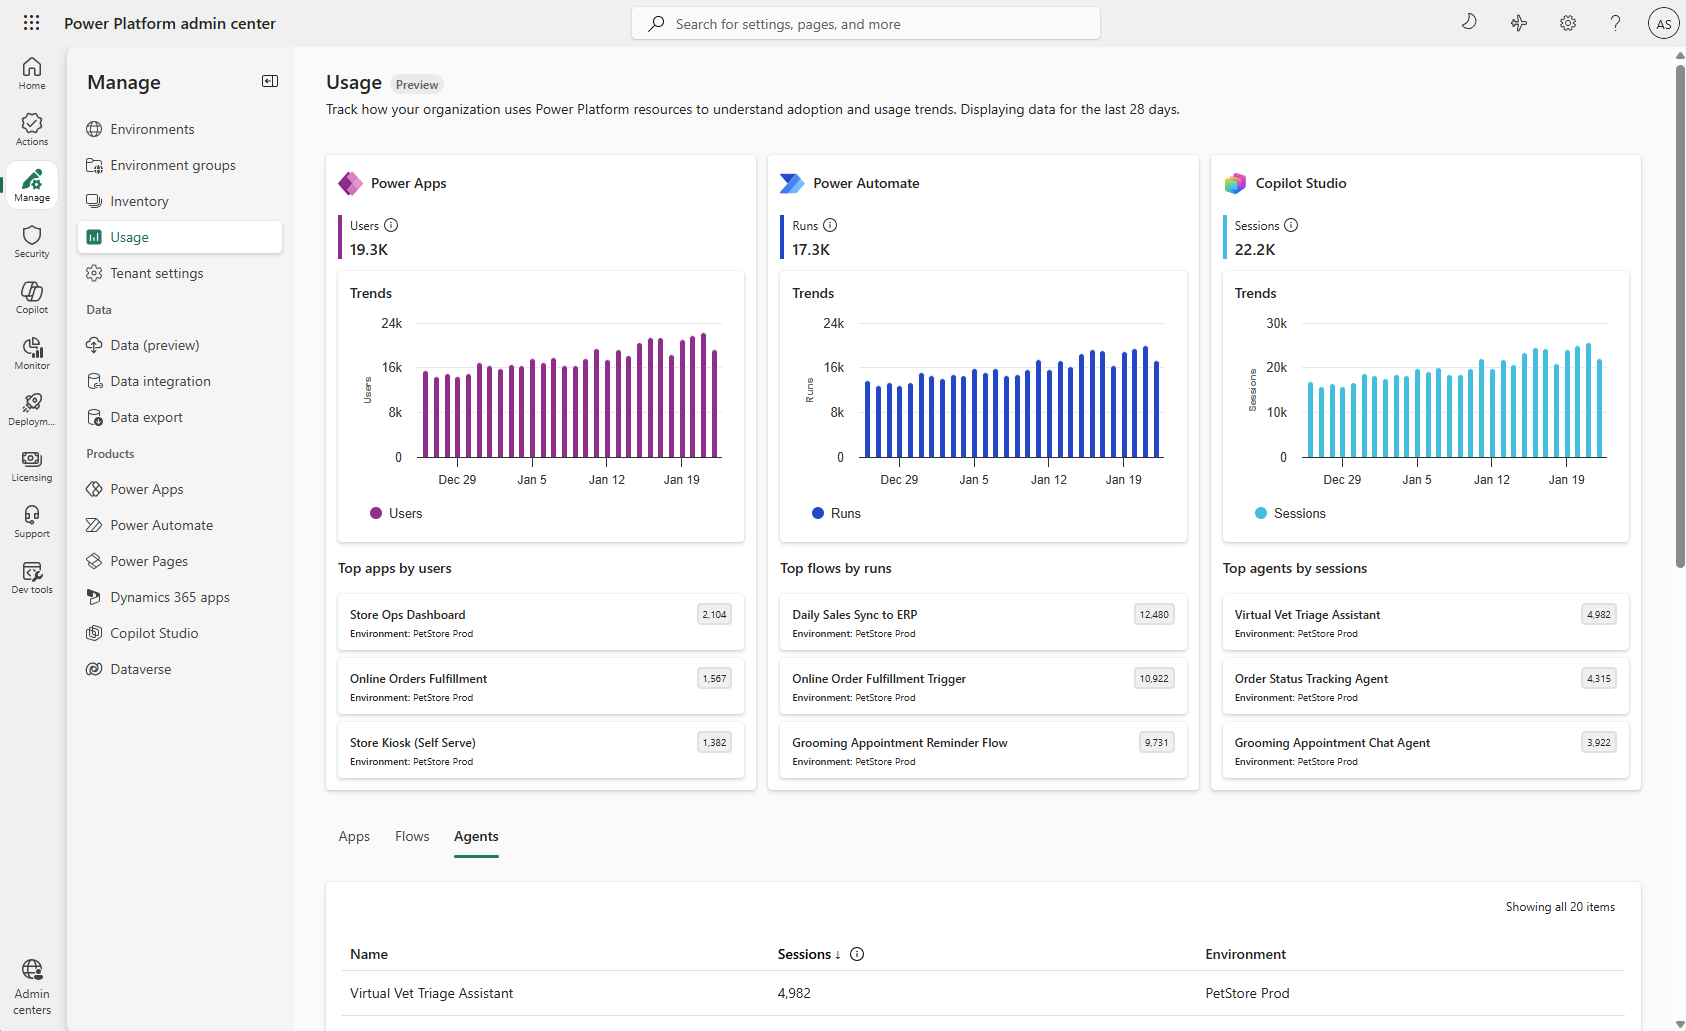
![Screenshot from Usage view in the Power Platform admin center showing usage trends in Power Apps, Power Automate and Copilot Studio]](https://newed.any0.dpdns.org/en-us/power-platform/blog/wp-content/uploads/2026/01/Usage-main-screen-1024x626.webp)
Why we built the new usage page
We heard customers’ feedback and requests for a reliable, unified view of usage across the platform. Organizations depend on Power Platform to accelerate digital transformation – and now, with the usage experience, they can:
- Understand adoption patterns
- Identify top-performing solutions
- Detect emerging opportunities or risks
The new usage page consolidates usage metrics across Power Apps, Power Automate, and Copilot Studio, giving admins a single pane of glass to see how apps, agents, and workflows are built and used in their organization.
What’s included in the public preview
During public preview, admins get access to a view featuring:
Summary view
A high-value snapshot of how your organization is engaging with the platform:
- Adoption over time – Track daily active usage over the last 28 days
- Usage by product – View aggregated usage across:
- Power Apps → Active users launching apps
- Power Automate → Flow runs
- Copilot Studio → Agent sessions
- High-value resources – Quickly identify the top three apps, flows, and agents driving adoption
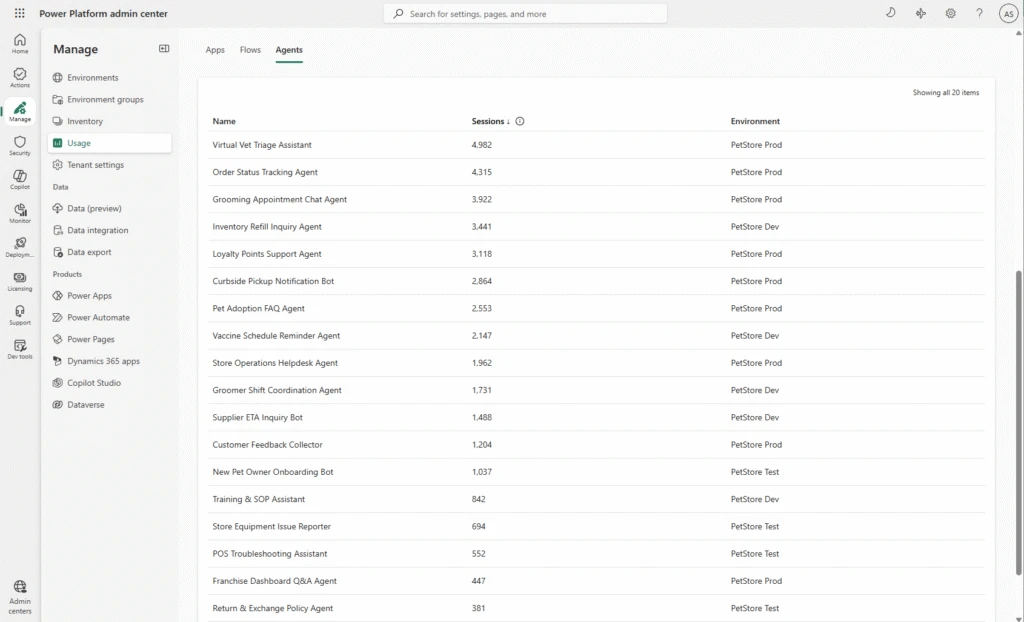
Detailed resource tables
Interactive, sortable tables let you explore usage trends across individual items, making it easy to identify which items are driving the most usage. The following item types are supported across Power Apps, Power Automate, and Copilot Studio:
- Power Apps – Canvas and model-driven apps
- Power Automate – Cloud flows
- Copilot Studio – Agents built in Copilot Studio
These tables help admins pinpoint trends, track growth, and troubleshoot issues at the resource level.
Get started today and shape the product
Visit the Learn documentation on usage page or go straight to your Power Platform admin center → Manage → Usage to learn more and explore the new Usage view.
We look forward to hearing how you use these insights to help your organization grow adoption and unlock even greater value with the Power Platform. And we’ll be continuing to build on this unified view leveraging your feedback – so don’t hesitate to share it with us.